Monitor Data Screen
This project offers a 12-screen platform for O&M personnel, featuring real-time data visualization with customizable layouts and interactive charts.
Tech Stack :


Project Overview: Large Screen Data Display Platform
This project aims to provide a centralized large screen data display platform for operations and maintenance (O&M) personnel. The platform consists of 12 smaller screens that can display various data and metrics as required by the O&M team. The team submits their data display requests, and we analyze the best way to present the data and develop the interface to display the data in a clear and intuitive manner.
Key Features:
-
Customizable Data Display: O&M personnel can customize the content and layout of the display based on their needs, ensuring that the most critical data is presented in real-time.
-
Efficient Data Visualization: Provides charts, dashboards, and other display formats to help O&M personnel quickly understand trends and key metrics.
-
Responsive Design: The 12 small screens can be flexibly allocated to different views based on the requirements, allowing for multiple views to be displayed simultaneously, ensuring smooth information flow.
-
Real-Time Data Updates: Supports real-time data updates, ensuring that O&M personnel have access to the most up-to-date information to make timely decisions.
Data Sources and Backend Integration:
This project integrates multiple data sources to provide O&M personnel with comprehensive, real-time information. The primary data sources include:
-
ES Log Data: Logs from Elasticsearch are retrieved to monitor and analyze system status and anomalies in real-time.
-
Grafana Metric Data: Metrics from Grafana are collected to display system performance indicators such as CPU, memory, and disk usage.
-
Vendor API Data: Vendor APIs are integrated to collect data on hardware devices, service status, and other external system data, ensuring that O&M personnel can monitor the environment from all aspects.
Throughout the development process, I work closely with these different backends to ensure stable and accurate data retrieval and display on the large screen.
Technology Stack:
- Vue2: Used for building the frontend interface, providing a reactive and component-based structure for efficient development.
- ECharts: A powerful charting library used to visualize data through interactive graphs and charts.
- Axios: A promise-based HTTP client used for making API requests and fetching data from the backend.
- Datav: A UI component library tailored for data visualization and dashboard creation, helping to build a clean and functional user interface.
Development Process:
- Requirement Analysis: Communicate with O&M personnel to define data display requirements and objectives.
- Data Visualization Design: Based on the requirements, design suitable visualizations and layouts.
- Interface Development: Develop the front-end interface, ensuring its aesthetics and usability.
- Deployment and Optimization: After development, deploy the solution to the large screen environment, test it, and optimize the performance to ensure smooth and stable operation.
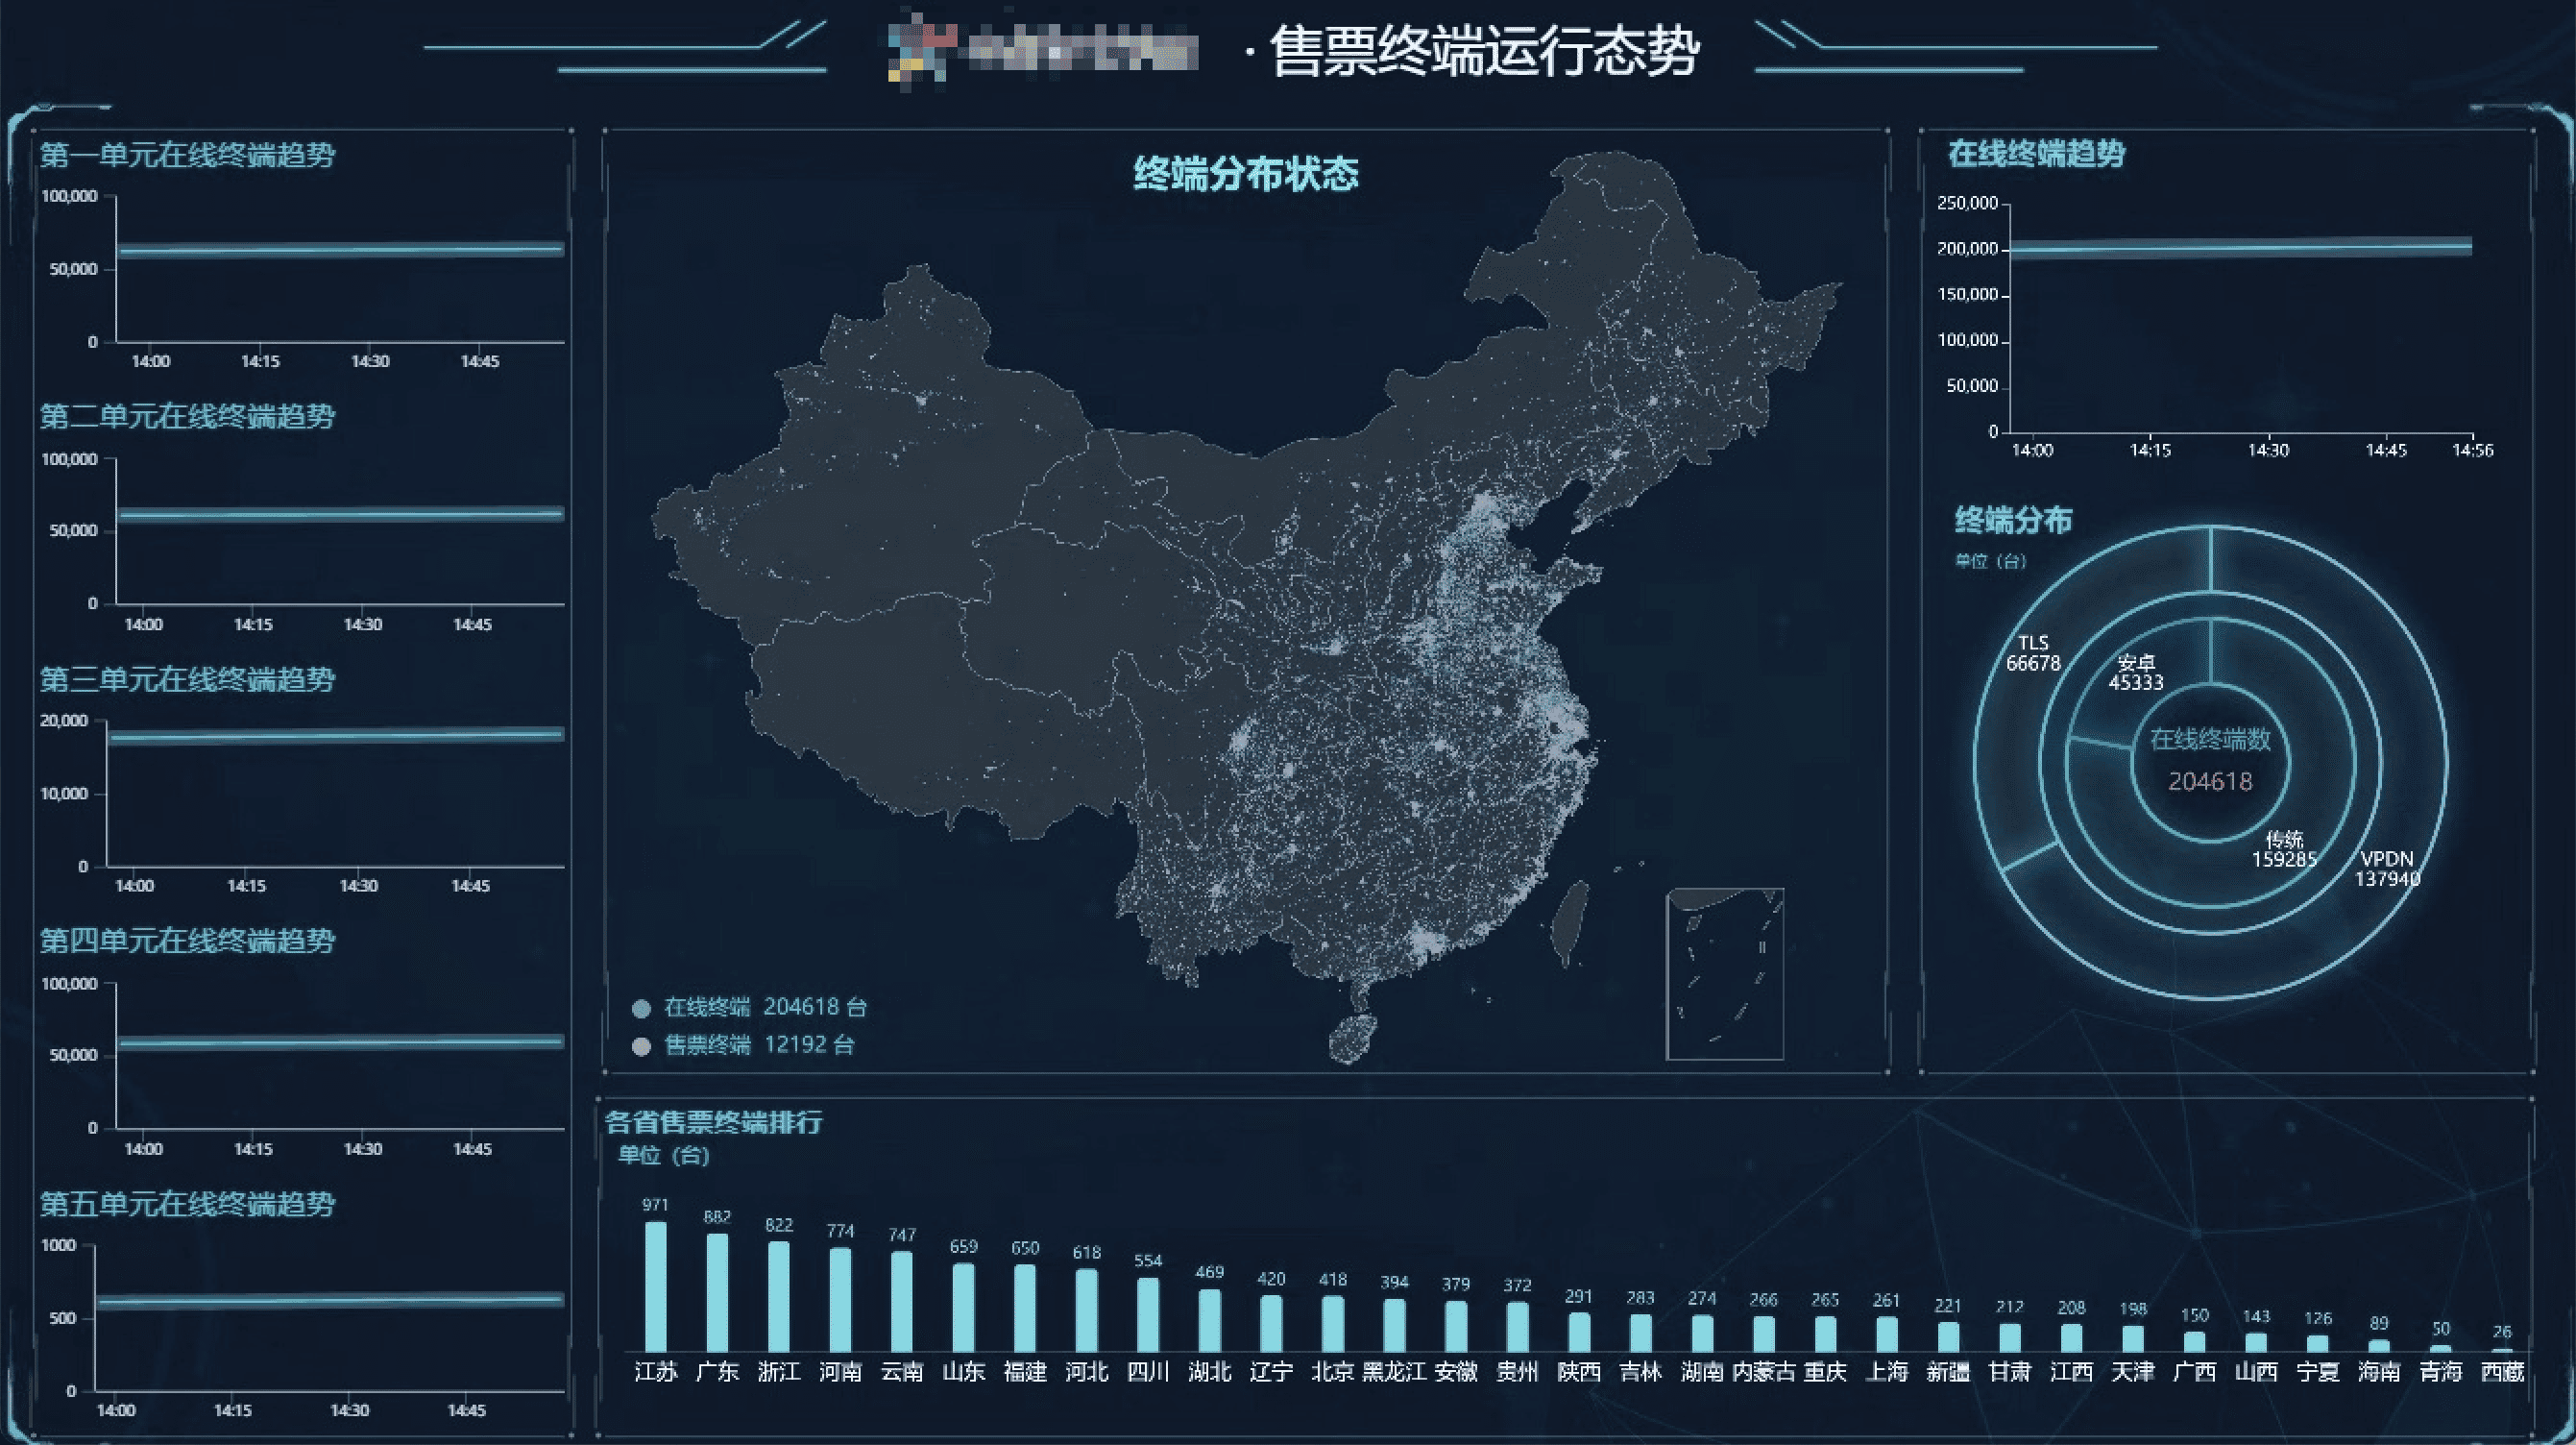
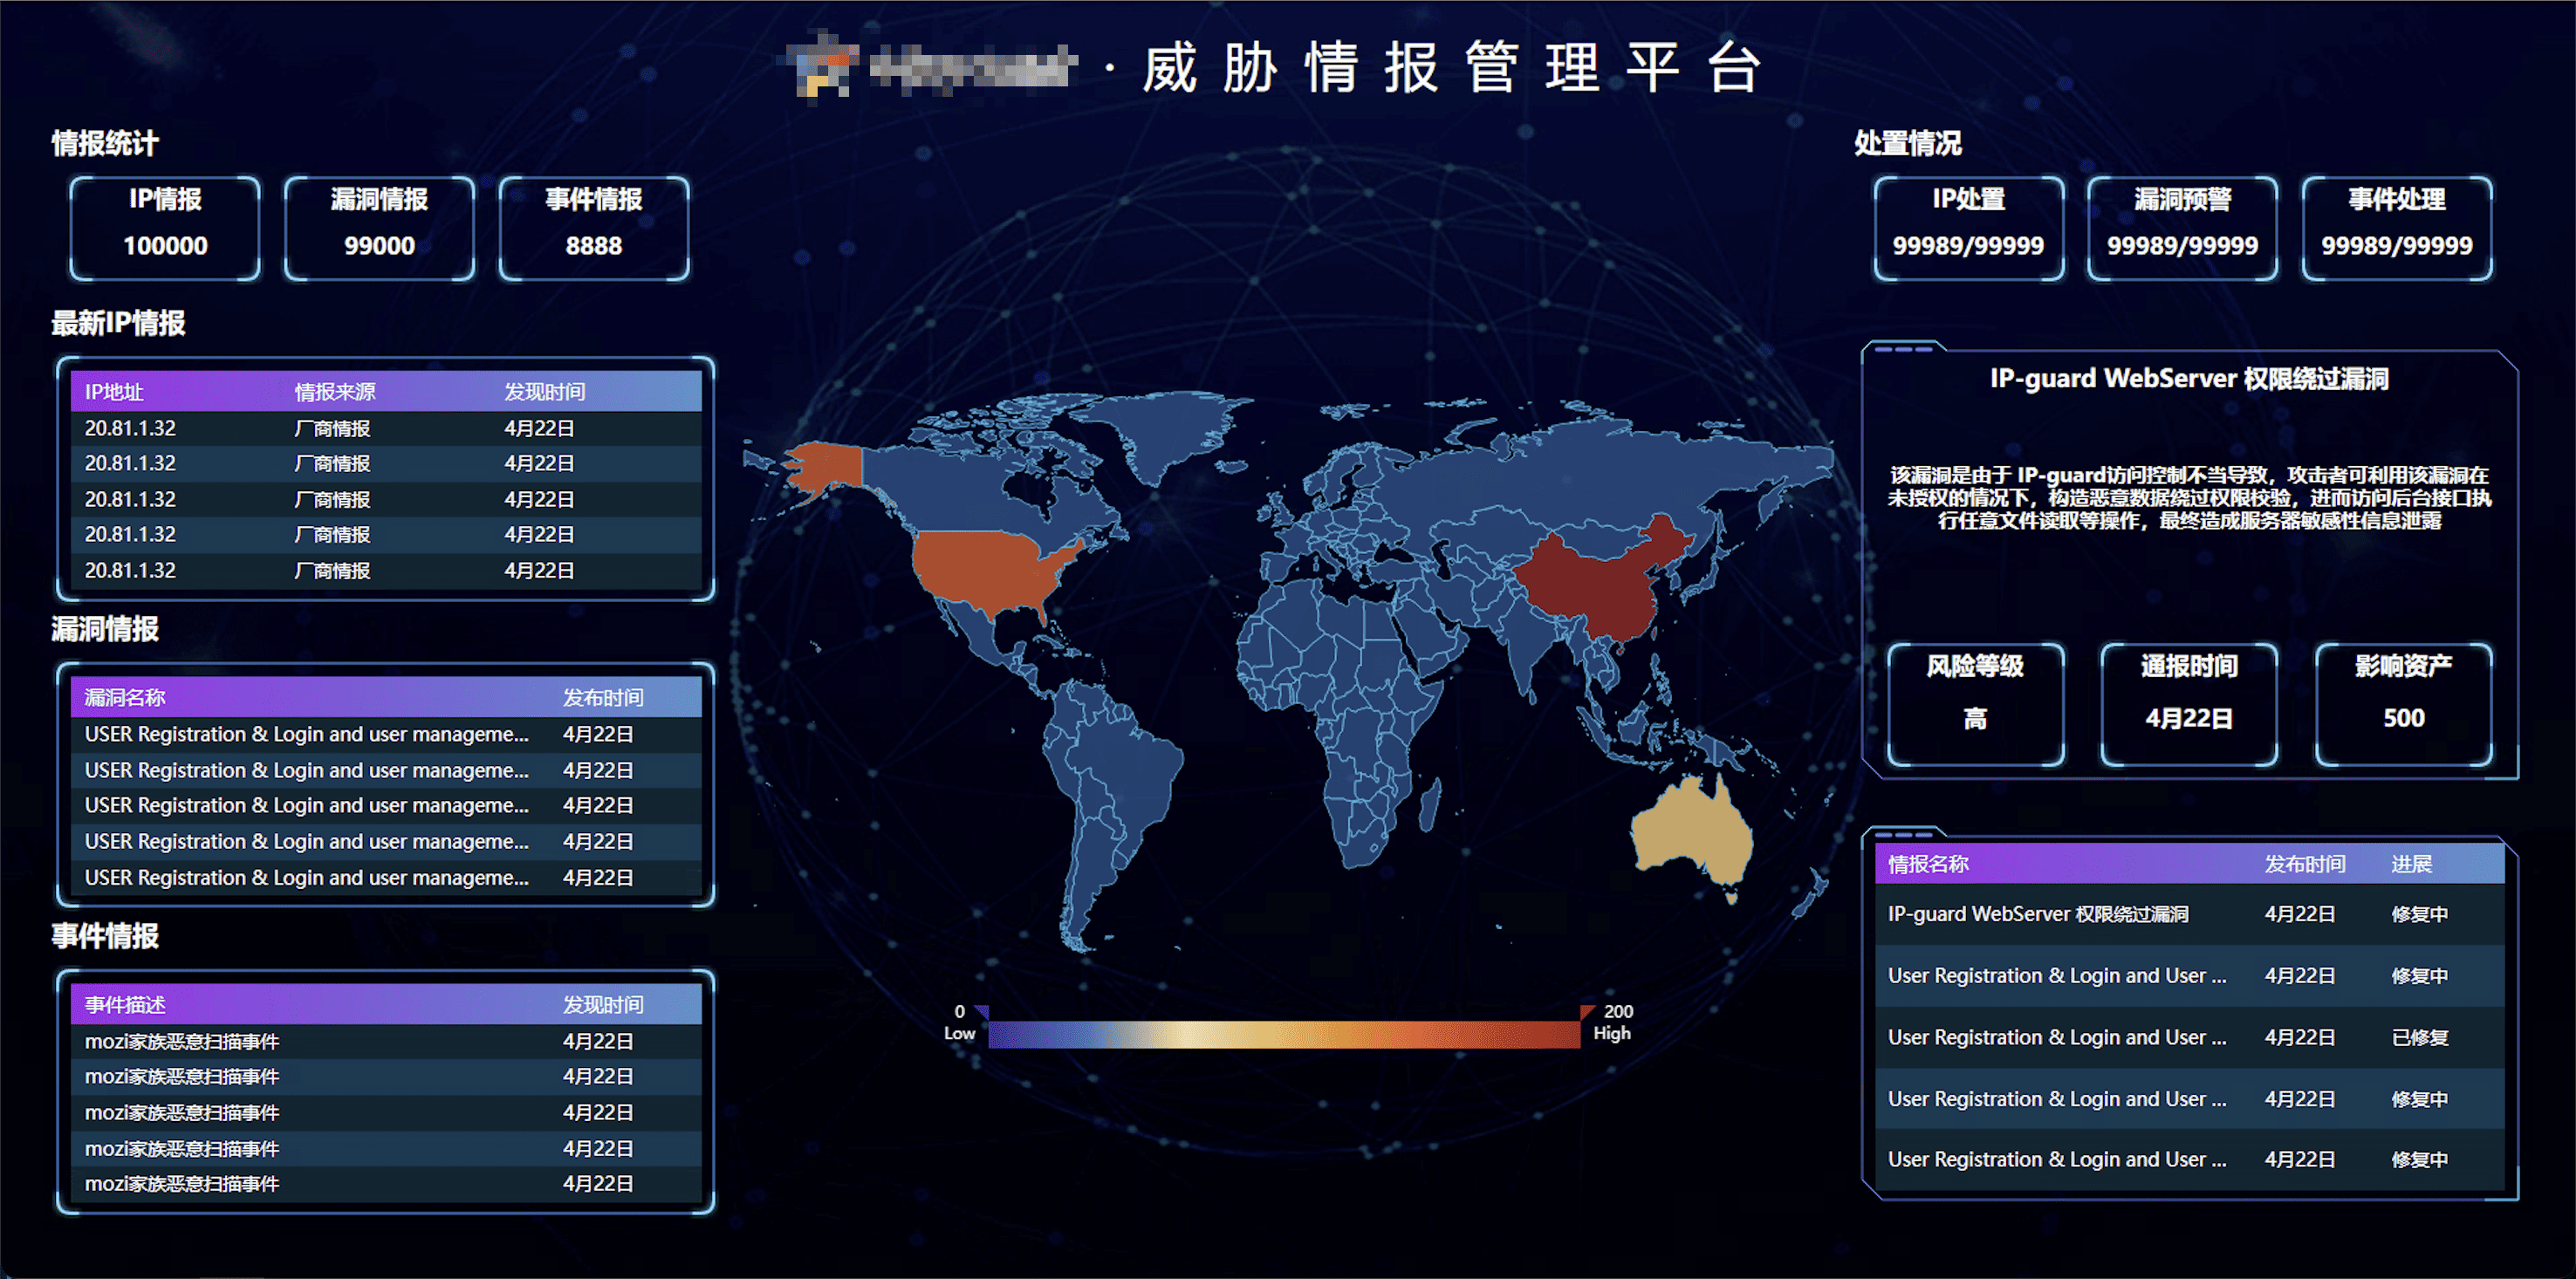
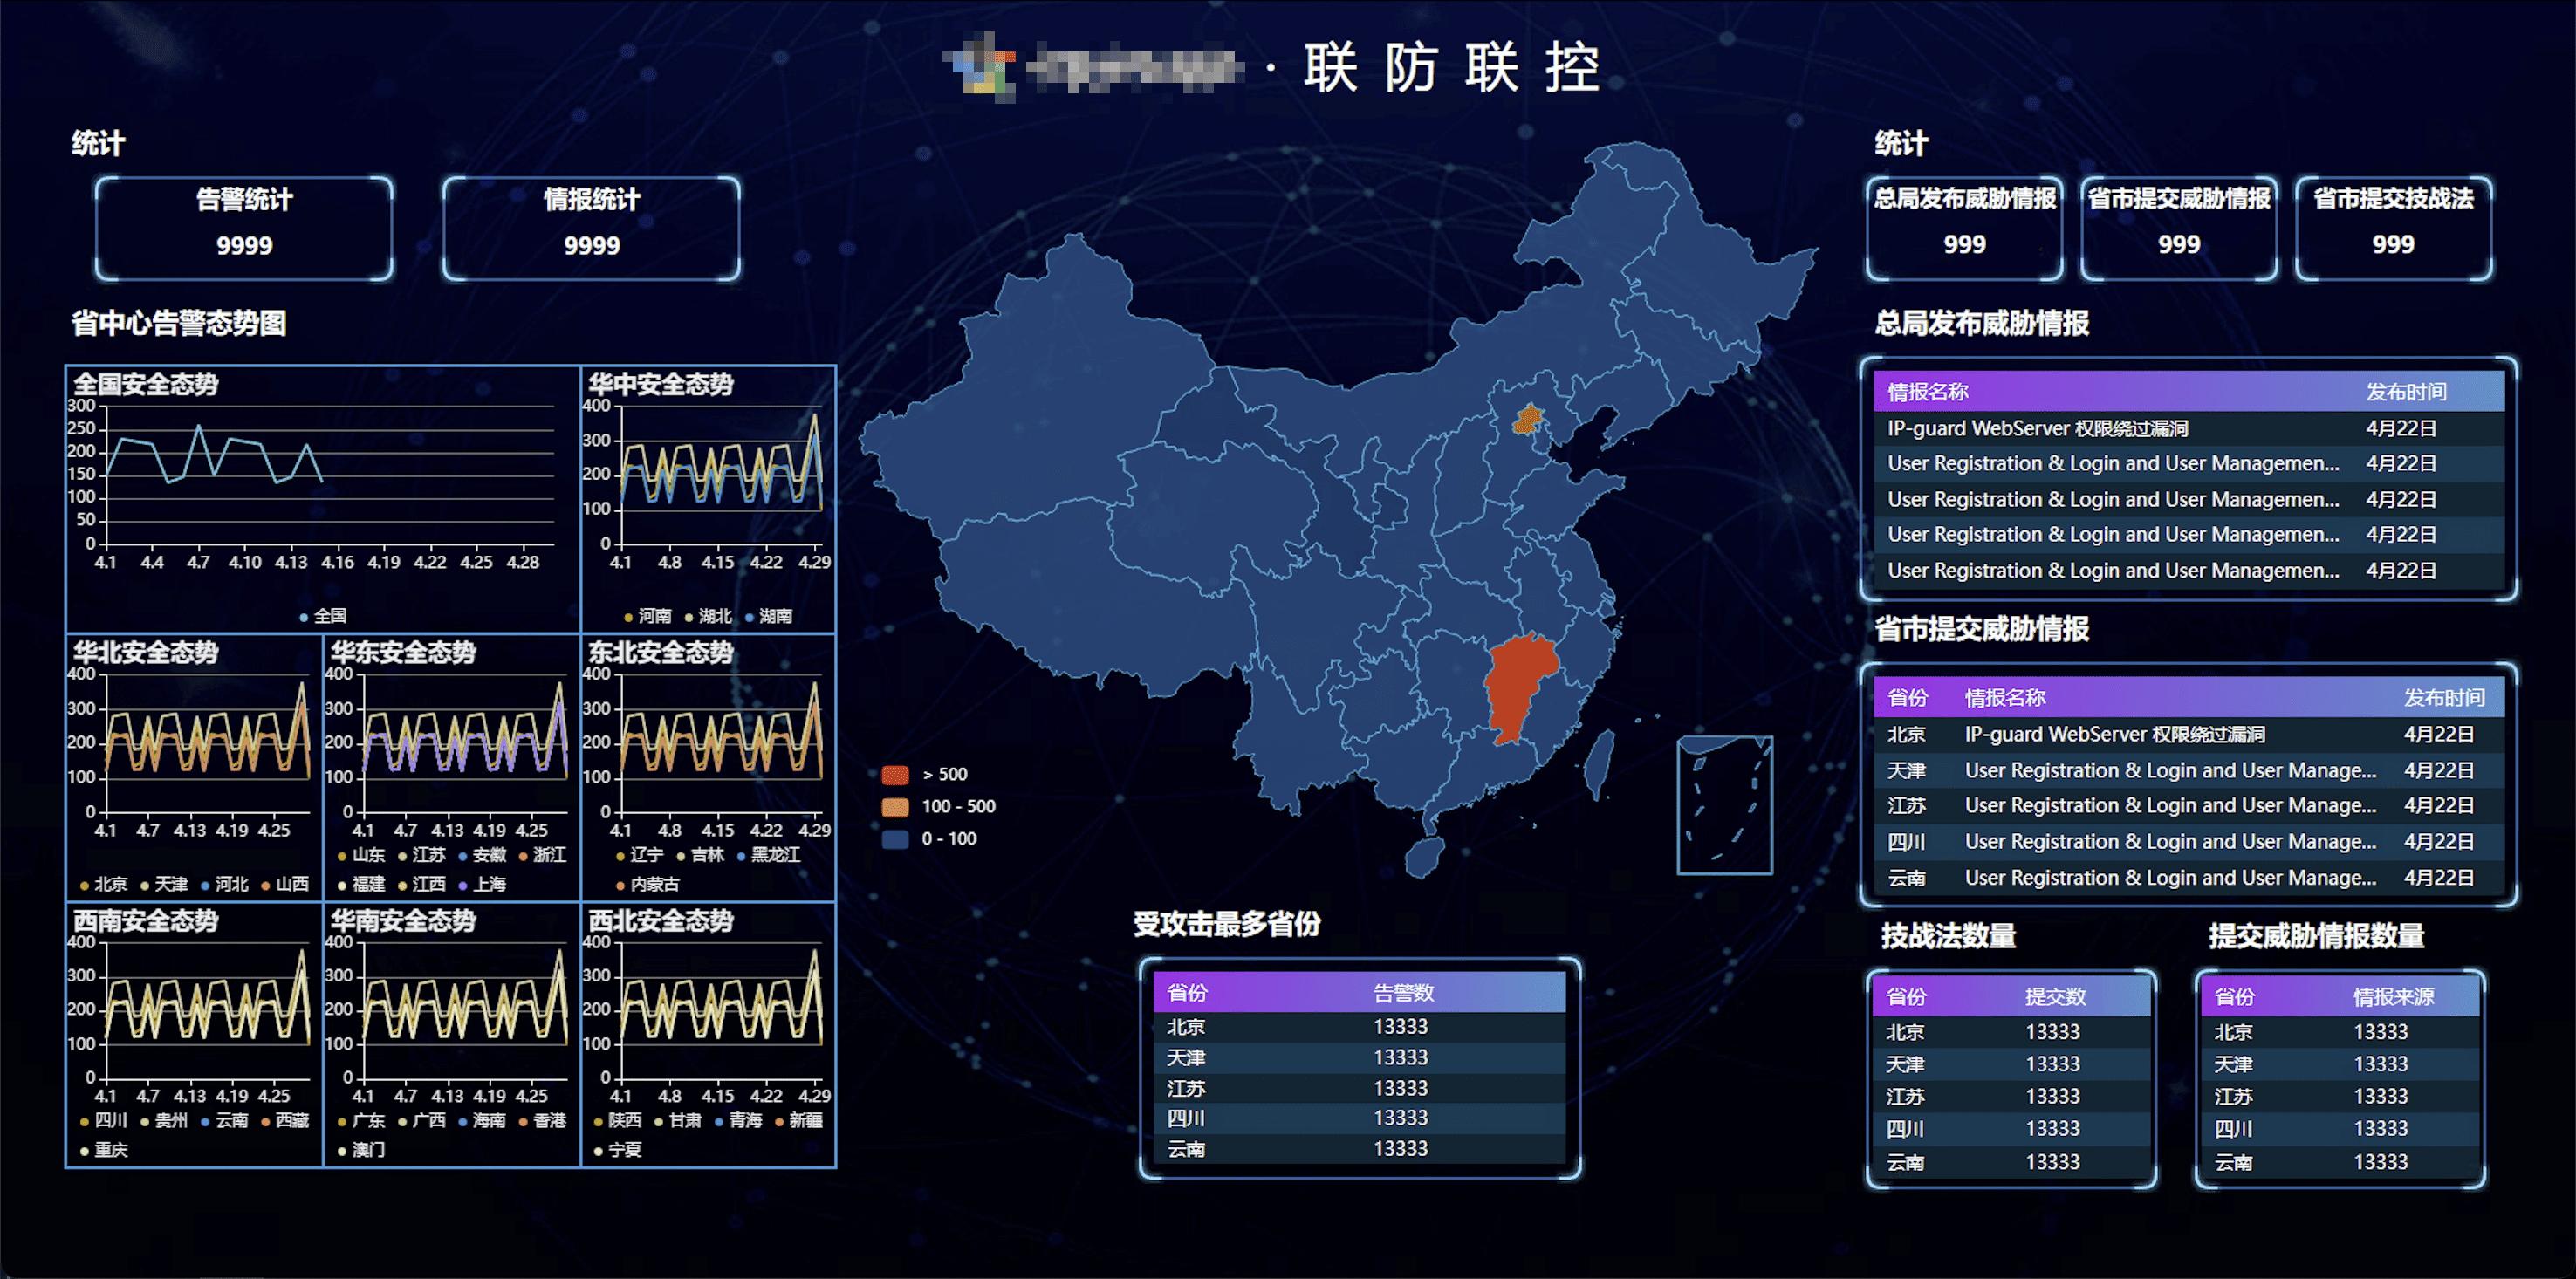
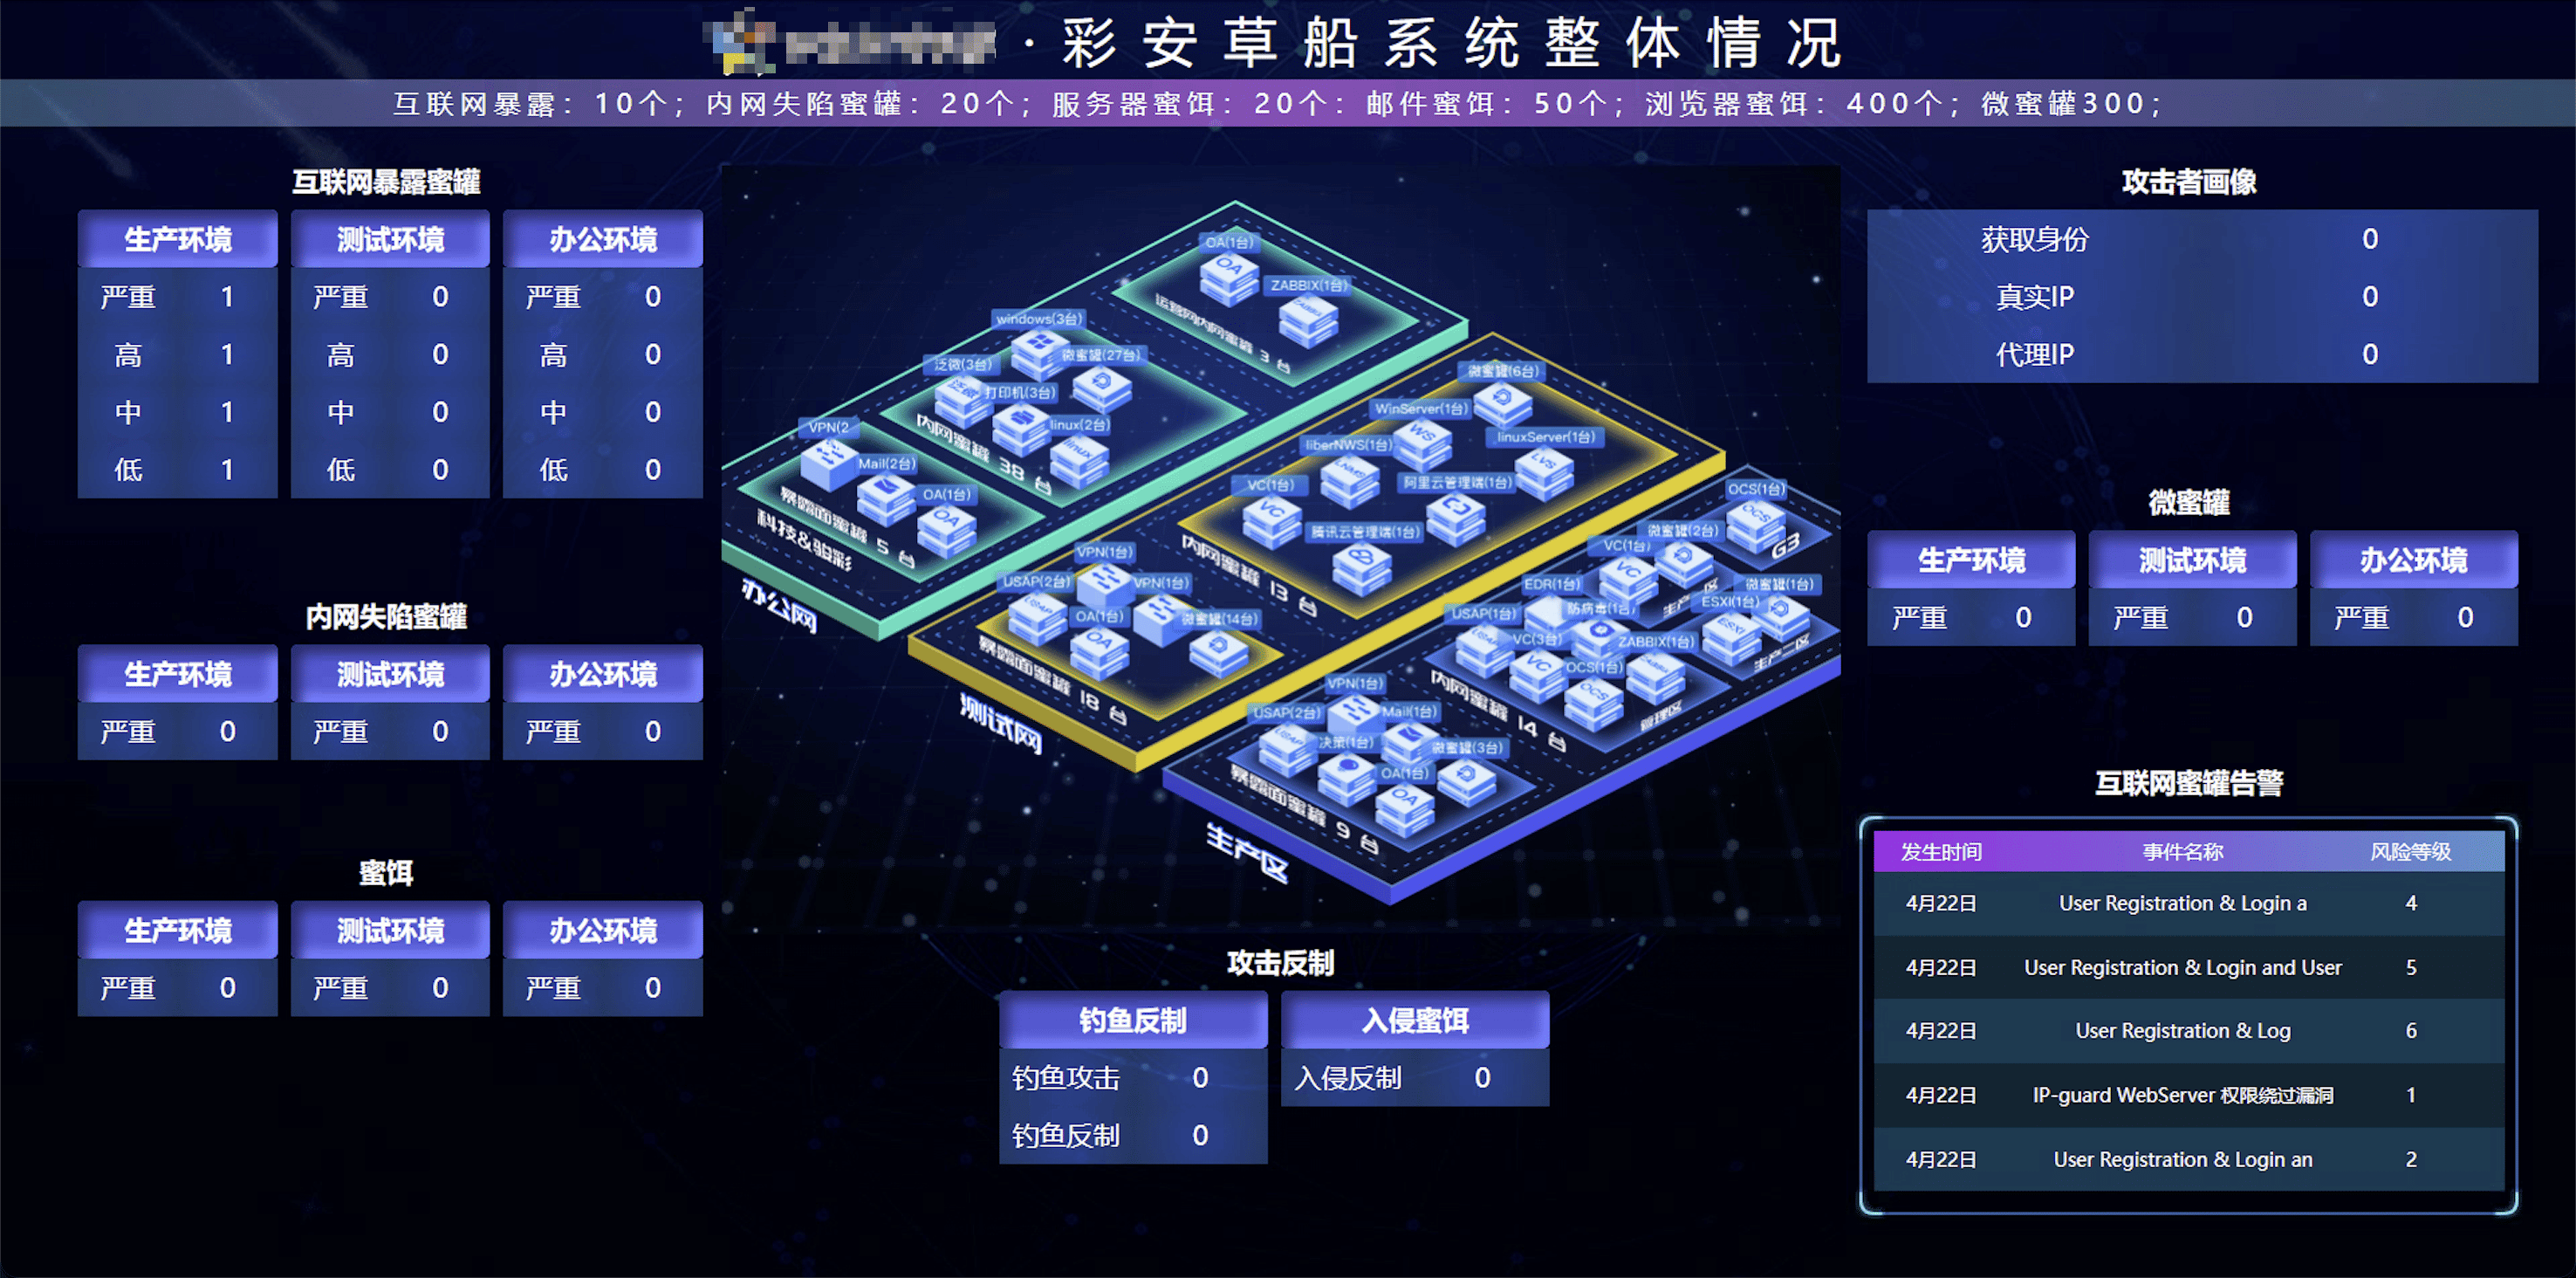
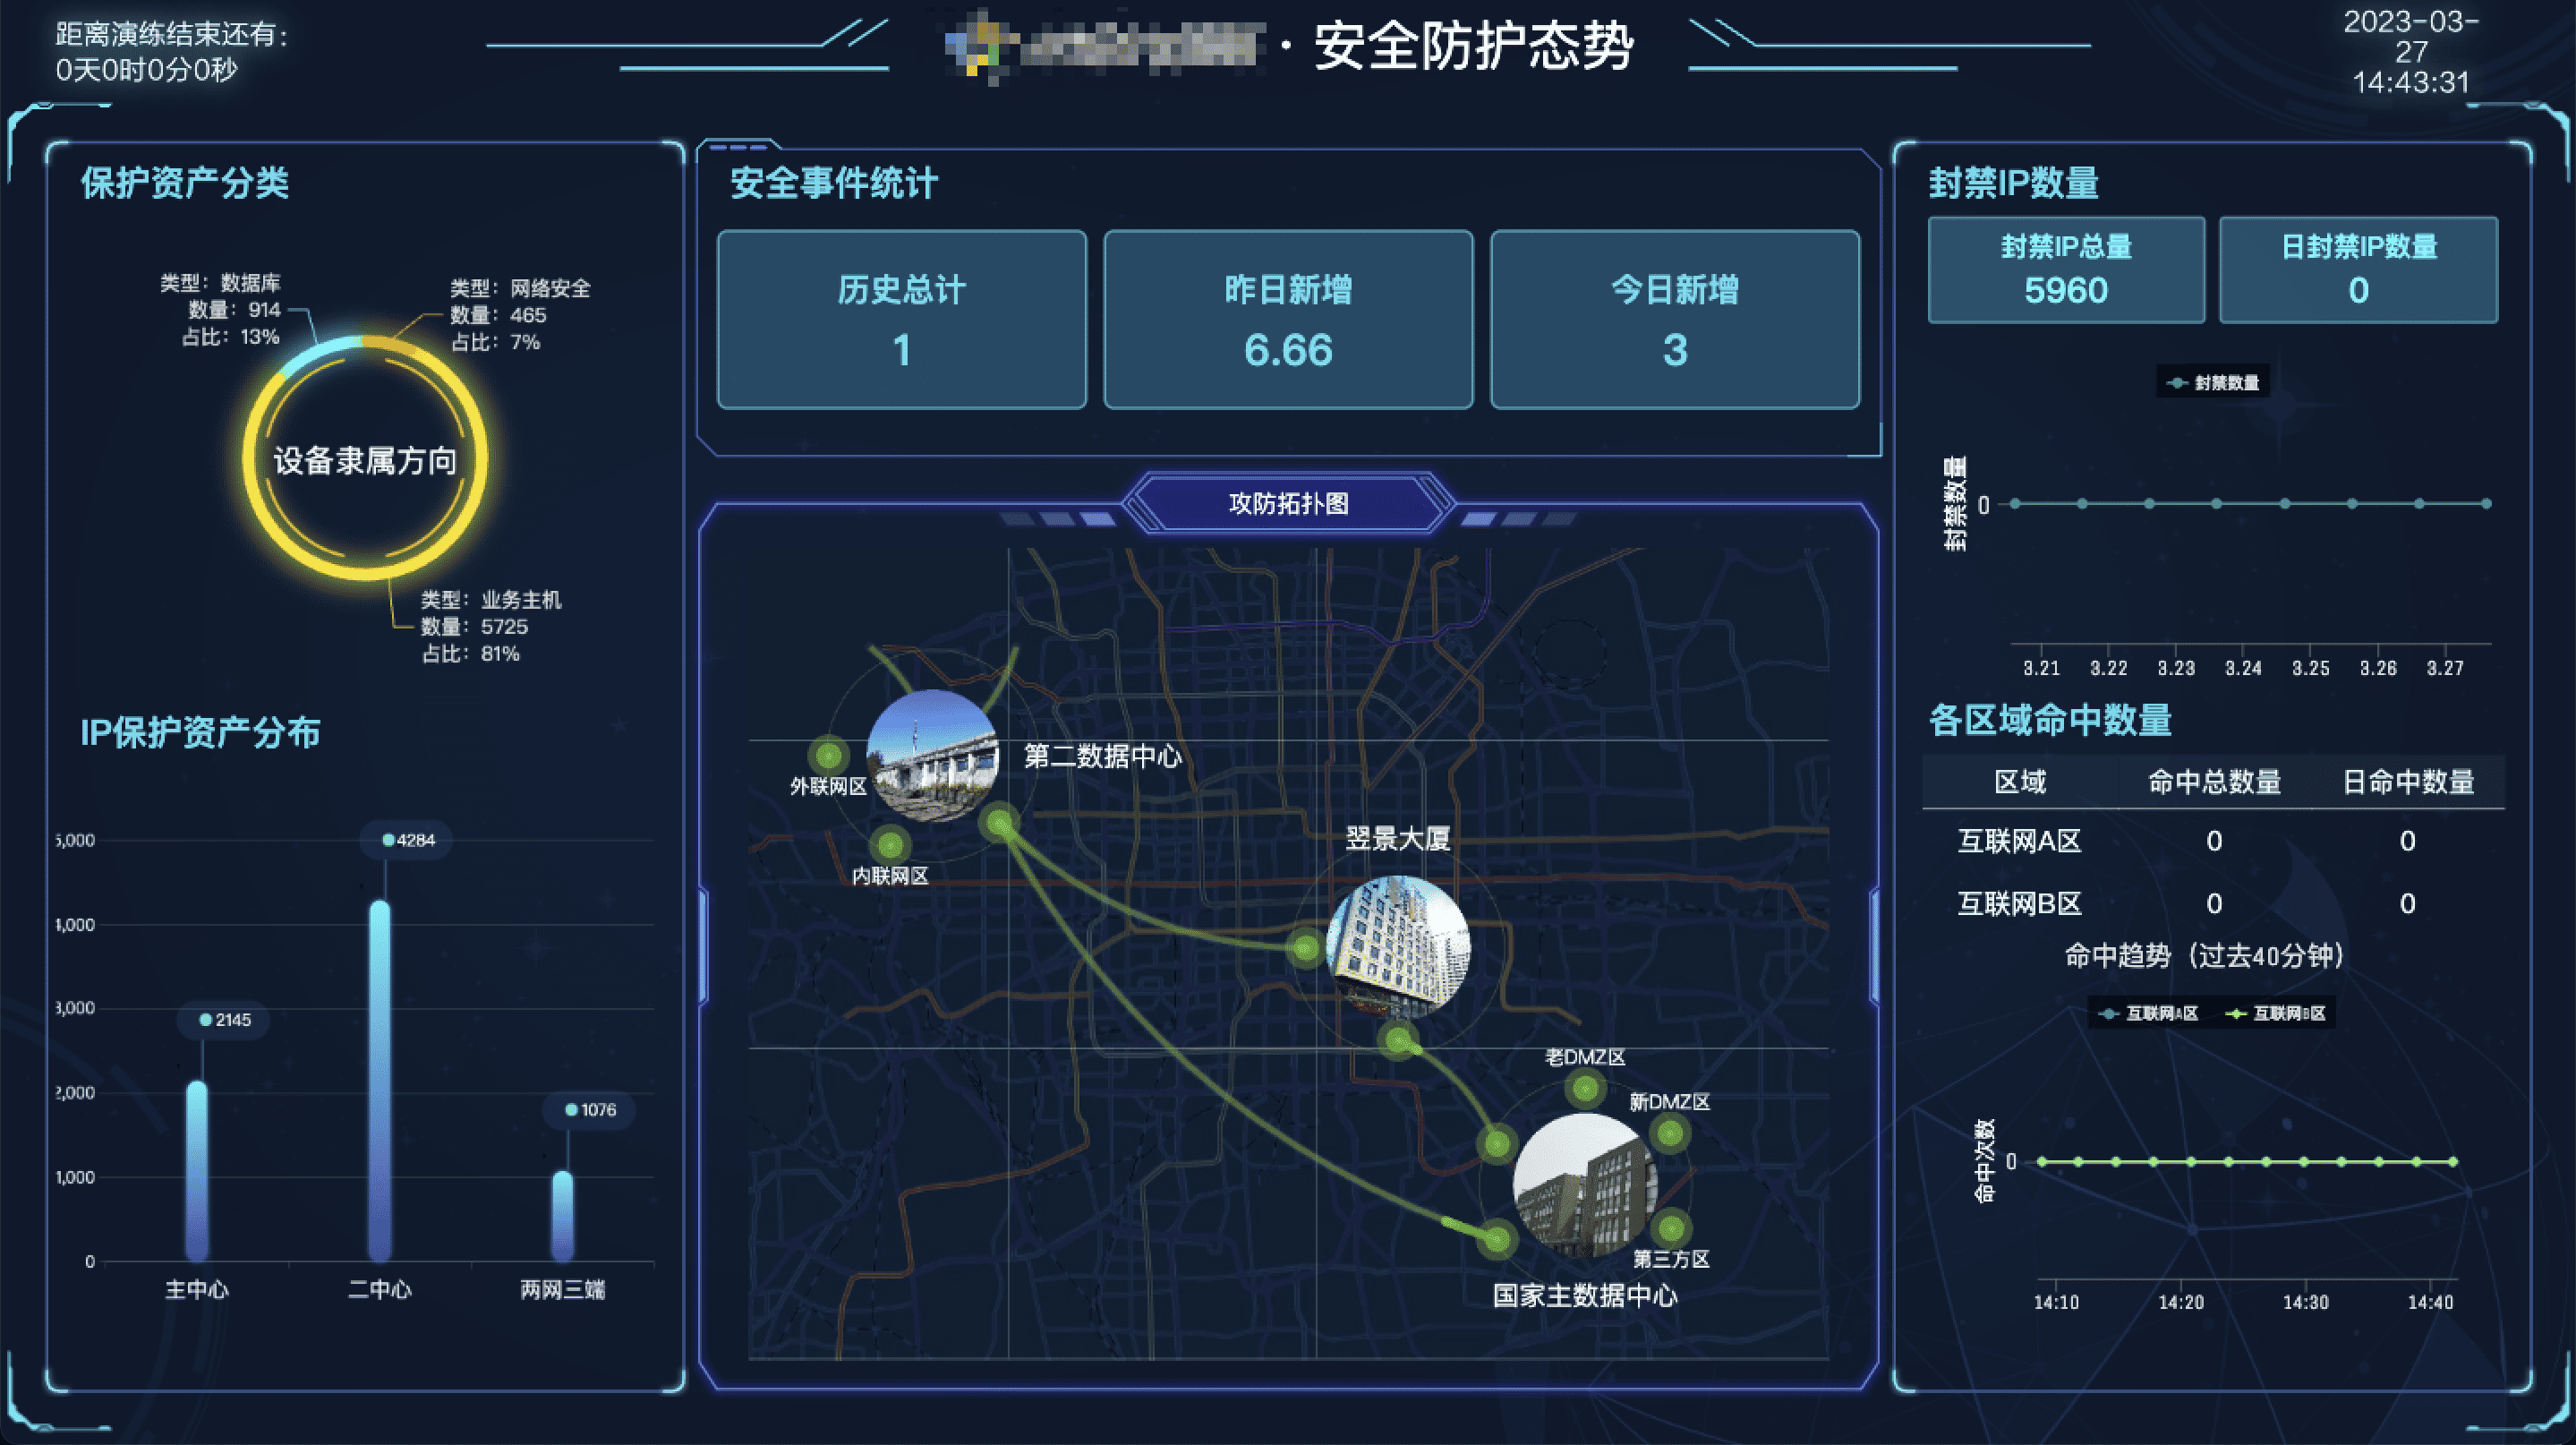
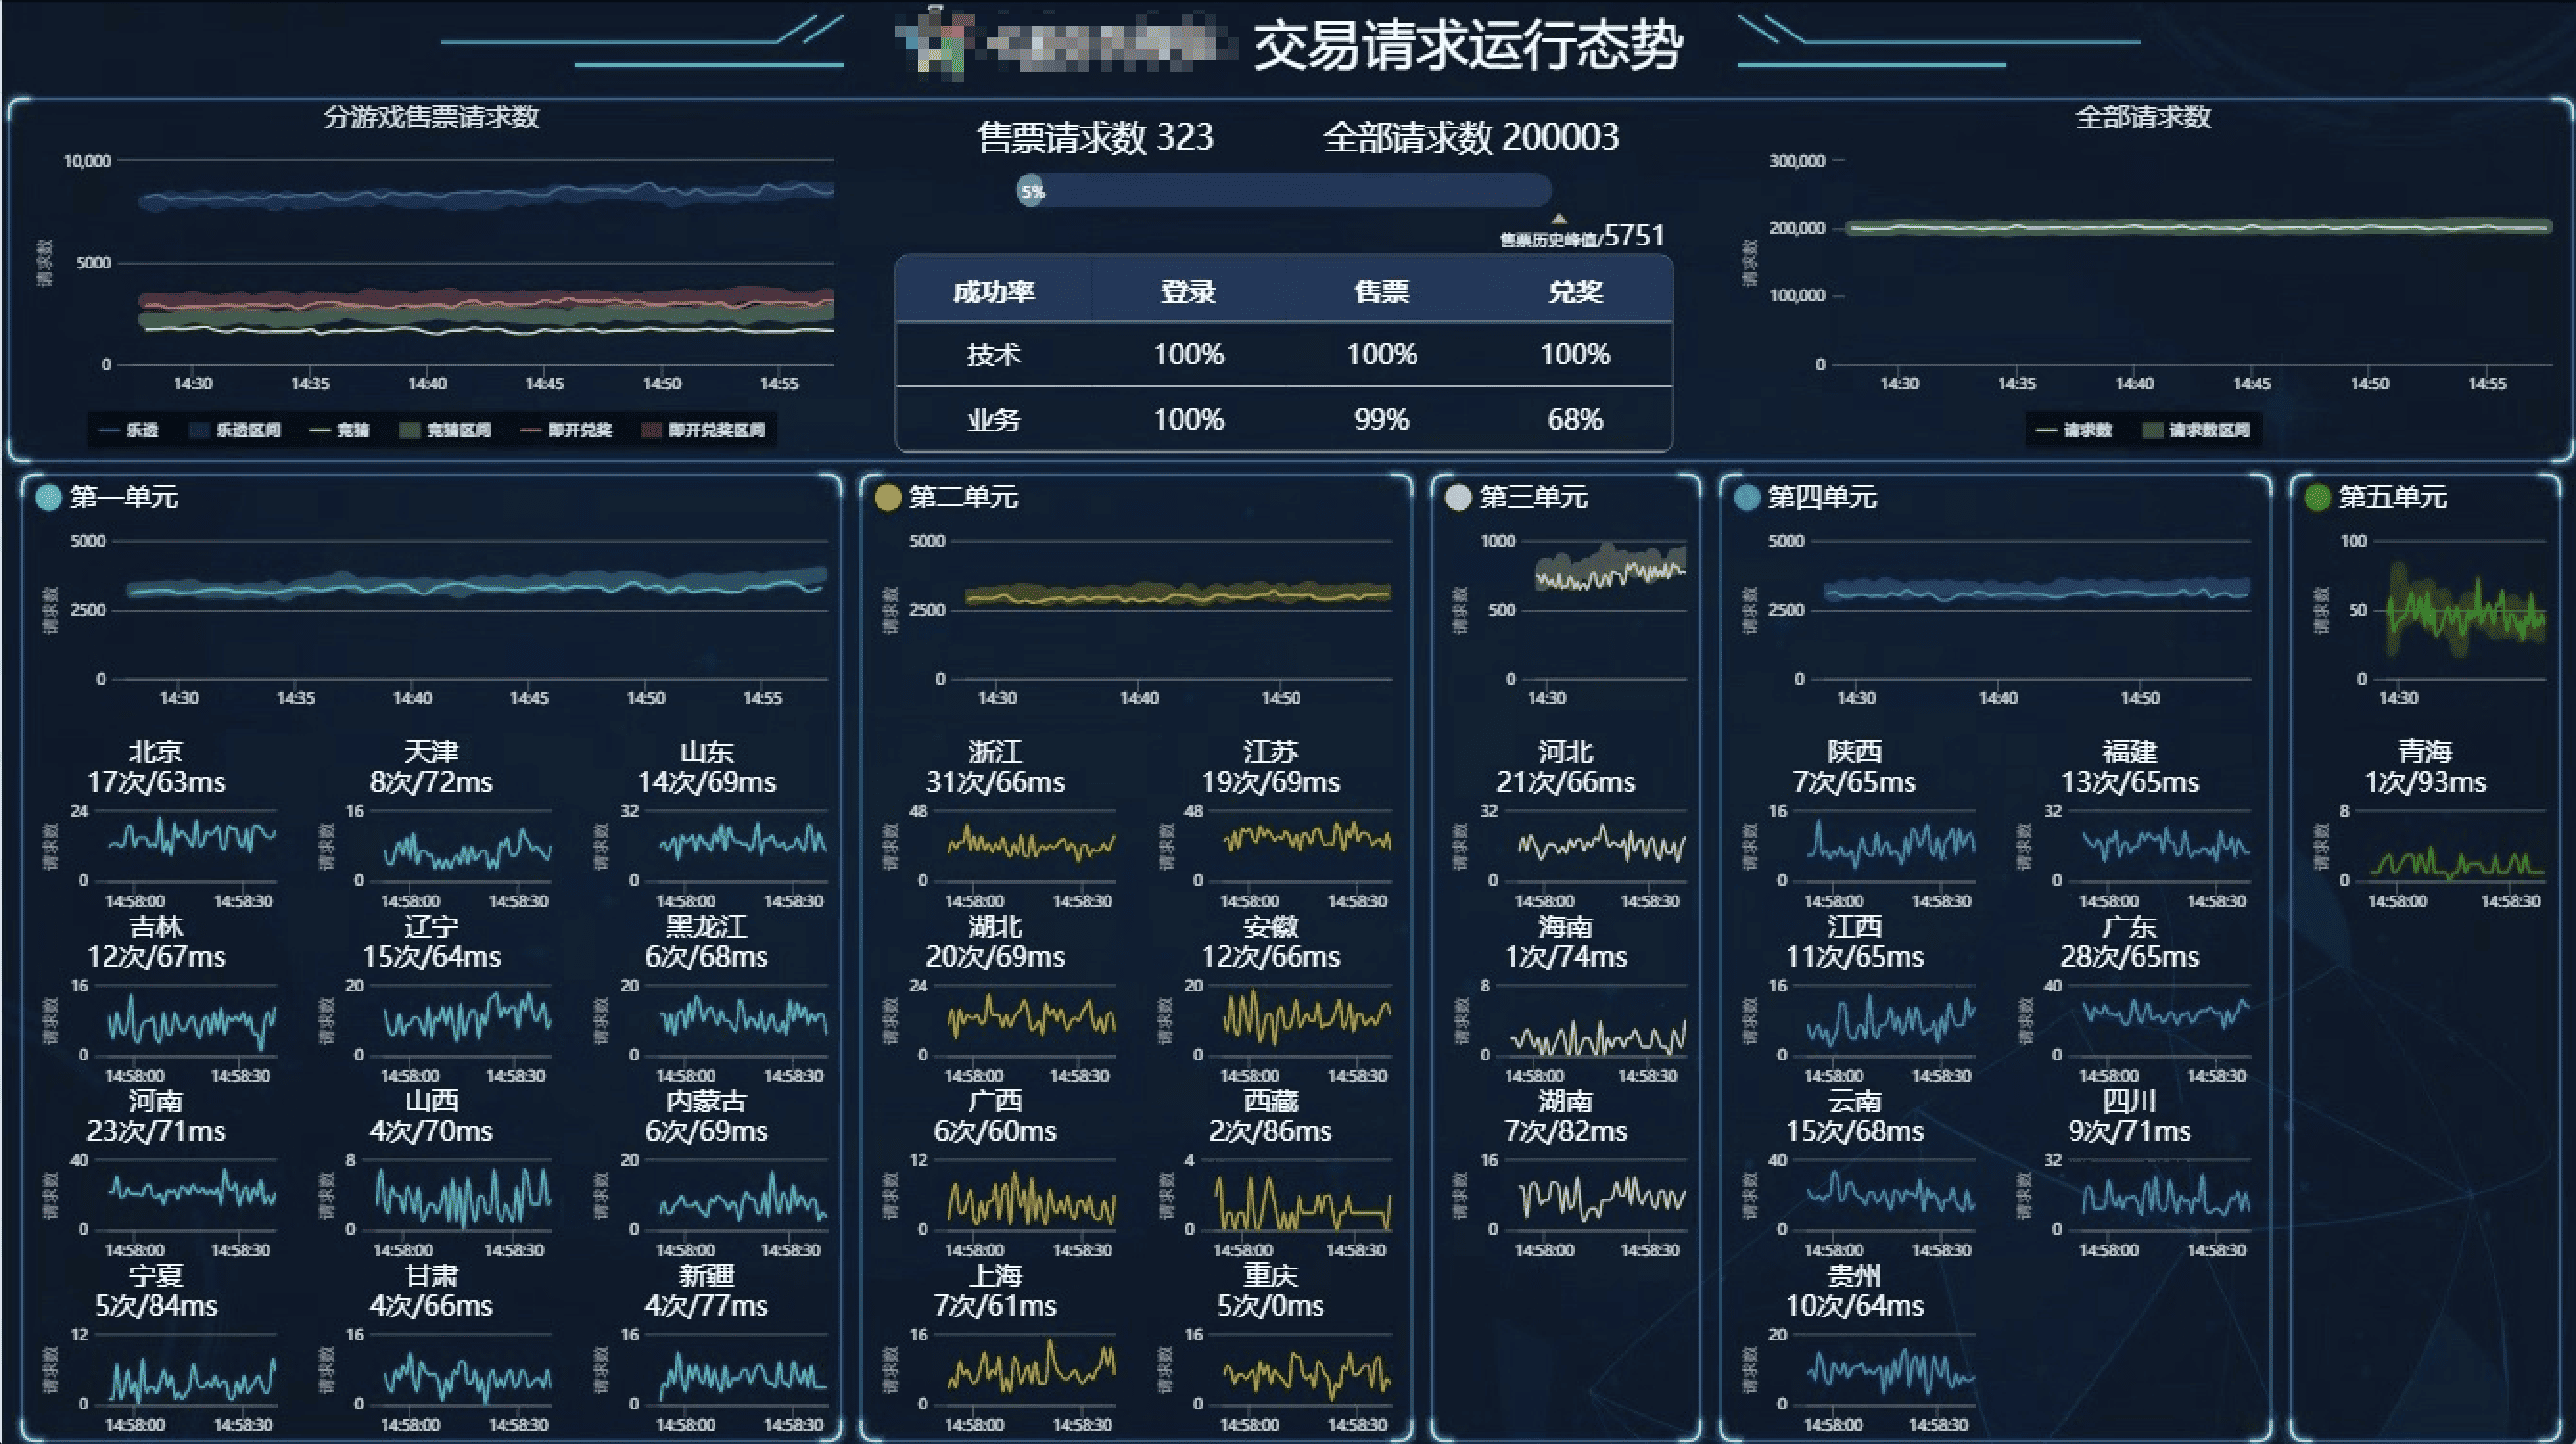
Project Screenshots:
(Here, you can insert screenshots of the large screen project, showcasing the interface and data visualizations you’ve designed)